Leveraging the information hidden away inside your IT systems is a critical part of improving your business. Traditionally this involved printing reams of paper with rows and columns of information, which you would diligently trawl through and analyse. The problem is that these reports are static, and your business is dynamic. If you want to analyse some information in more detail then you need to run (or worse, build) another report.
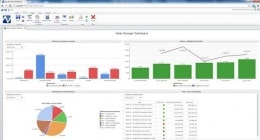
These days businesses want dynamic access to their data. They want dashboards that summarise their data and present key performance measures in the form of dynamic charts and tables. They want automatic notifications, traffic lights and gauges that allow them to quickly identify issues in the business.
Microsoft Dynamics NAV
Microsoft Dynamics NAV’s Dimensions and other data structures provide an excellent foundation for businesses to analyse their data. Account Schedules, and Analysis by Dimensions provide basic analysis capabilities for smaller companies. Dynamics NAV 2009/2013 provide ‘live’ linking to NAV from Excel. Dynamics NAV 2013 then provides charting capabilities to present this information graphically in your role centre.
Fenwick Gold extensions such as Advanced Analysis Reports, Advanced Budgeting and Forecasting, Report Distributor, and Advanced Account Schedules take this standard NAV functionality to the next level with minimal investment.
OLAP (Online Analytical Processing)
OLAP technology is like adding steroids to your reporting and analysis… and it’s legal! Once again, there are different levels of complexity and sophistication:
- PowerPivot for Excel was introduced by Microsoft with Excel 2010 and enhanced in Excel 2013. It utilises OLAP technology bundled into Excel and truly brought Business Intelligence to small businesses. It allows hundreds of thousands of rows of data to be analysed, charted, sliced and diced within an Excel spreadsheet. Fenwick has developed some pre-built PowerPivot tables to help you get started quickly.
- Full BI: The ultimate level of Business Intelligence (BI) is to implement a full OLAP system such as SQL Server Analysis Services. This allows millions of rows of information to be efficiently analysed. Excel can access OLAP data however more sophisticated and powerful options are available.
I will describe the functionality of PowerPivot in more detail in a future blog but feel free to contact me or one of the other consultants at Fenwick Software should you require any further information or advice.


