Business Intelligence systems have traditionally been expensive and time-consuming to implement, placing it firmly out of reach for small businesses. PowerPivot for Excel from Microsoft solves that problem.
PowerPivot is an add-in for Microsoft Excel 2010 and Excel 2013. It allows you to set up links to your database, extract this data to your spreadsheet (in a highly-compressed and optimised for PowerPivot form) and then generate pivot tables to analyse your data. The Excel 2013 version is more advanced than the Excel 2010 version.
You may already be familiar with pivot tables in Excel and wonder what the benefits are of PowerPivot. Some examples of the enhanced capabilities of PowerPivot over standard Excel and Pivot tables include:
- You cannot manipulate the data you extract from your databases (this is a good thing!)
- Relationships between tables are easily created using a graphical interface
- Advanced formulas can be set up on the model to allow analysis such as
- Parent-Child Hierarchies (e.g. expandable Chart of Accounts with roll-ups to each level)
- New and Returning Customers analysis
- Dynamic ABC classification to group items such as Products and Customers
- Time patterns such as Sales for Month, Sales Year-to-date (YTD), Moving Annual Total, Month-to-Month comparison, Previous Period total, …
- KPI calculations
Simple PowerPivot models can be built in a matter of hours. For example, I built the entire model and pivot table to allow me to view my Chart of Accounts, with rolled up totals by level, filtering by Income/Balance Sheet and Date in a couple of hours. PowerPivot is a simple, time-effective way to build powerful analyses of your data from Excel. It is perfectly suited to smaller businesses.
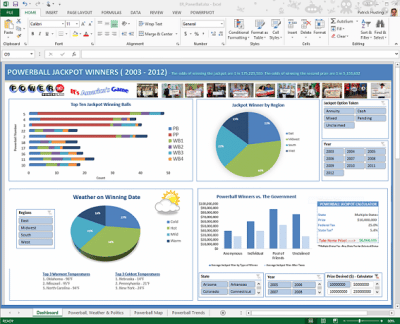
The following screenshot shows a more generic example of a PowerPivot chart.


