With Microsoft’s acquisition of our Gold for Power BI report packs, all Business Central users can now take advantage of a newly embedded reporting experience. These reporting packs enhance your reporting capabilities through embedded Power BI apps and reports. This provides you with the essential tools for making informed, timely decisions, and gaining valuable insights without leaving Business Central.
With over 70 new reports being embedded into Business Central, it can be difficult knowing which reports your organisation should start using. We’ve listed our top 5 embedded Power BI reports that provide you with deeper insights.
Maximise your business insights with these 5 Power BI reports
While the standard reporting overview pages in Business Central provide you with a comprehensive analysis of your business operations, our top 5 selected reports will provide you with a higher level of analysis. These 5 reports allow you to take a more strategic outlook on areas like sales, inventory, purchases, projects, and financial health.
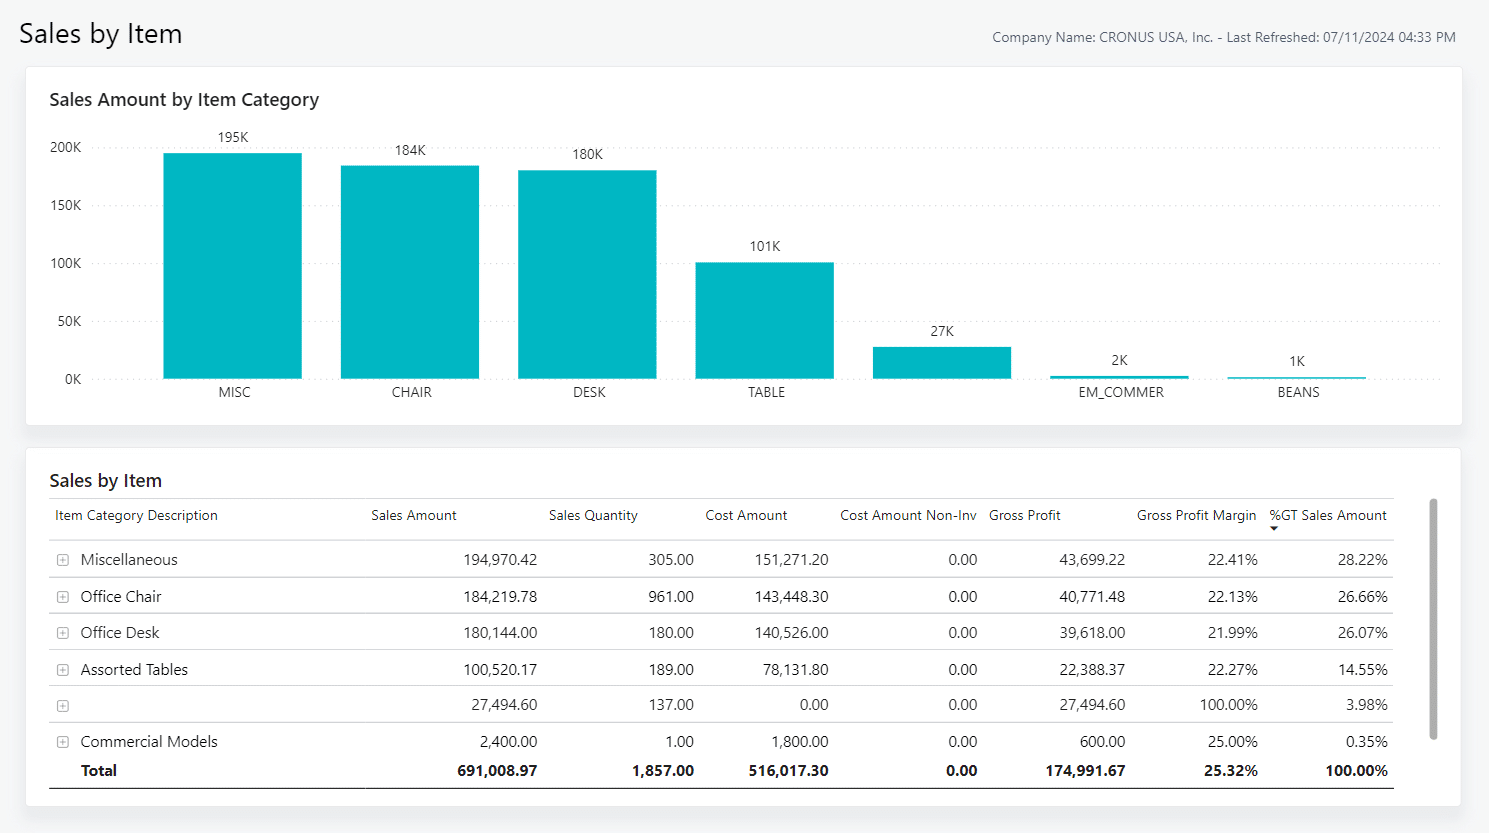
1. Sales by Item Report
The Sales by Item report in Power BI helps you fully leverage your data for informed decision-making. This report offers a clear, detailed view of item performance, displaying sales amounts, quantities, and costs for each item and category. Additionally, it enables you to break down data by individual customers, providing a deeper understanding of sales trends and customer preferences.
This report also makes it easy to identify top-performing items and understand each product’s contribution to your overall revenue. With this, you can prioritise inventory and sales efforts where they’ll have the greatest impact. The Sales by Item report also pinpoints items that may need extra support, whether through promotions or stock adjustments. This allows your team to respond to demand shifts, ensuring better inventory control and meeting customer needs effectively.
2. Gross Requirements Report
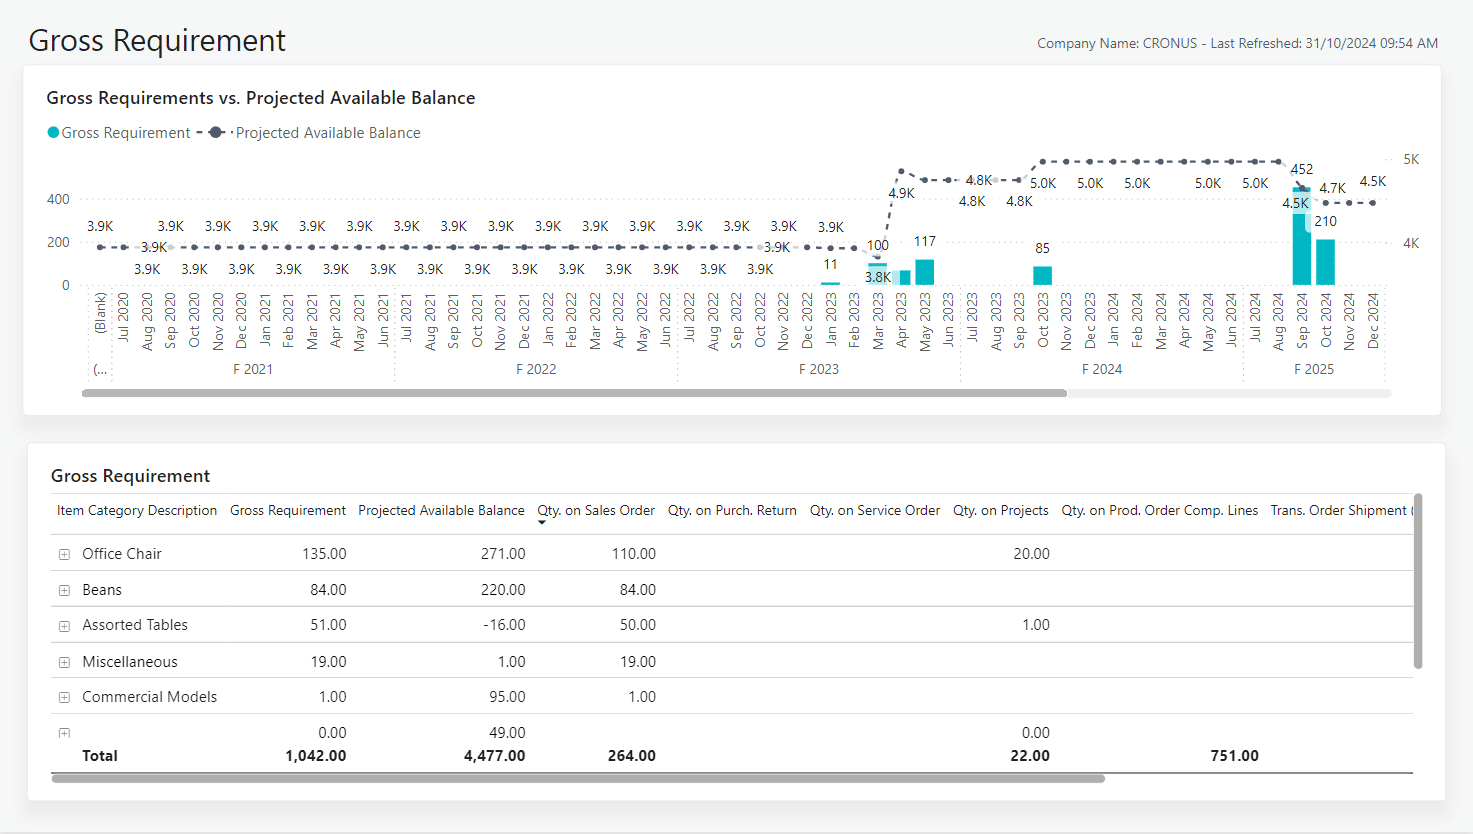
The Gross Requirement report provides you with a view of outbound transactions and helps you manage stock levels. The report shows the exact quantities needed per item and current inventory levels across your documents. One standout feature is the real-time updates from the Project Available Balance. This provides real-time updates of inventory levels and can help your team effectively track and fulfil demand efficiently.
It can also pinpoint bottlenecks by highlighting items where available balances may fall short, allowing you to address issues proactively. With a clear view of your sales and production volumes, your team can make confident, data-driven decisions about inventory requirements. This helps ensure you can maintain efficient stock levels to support production schedules and sales demand.
3. Aged Receivables Report
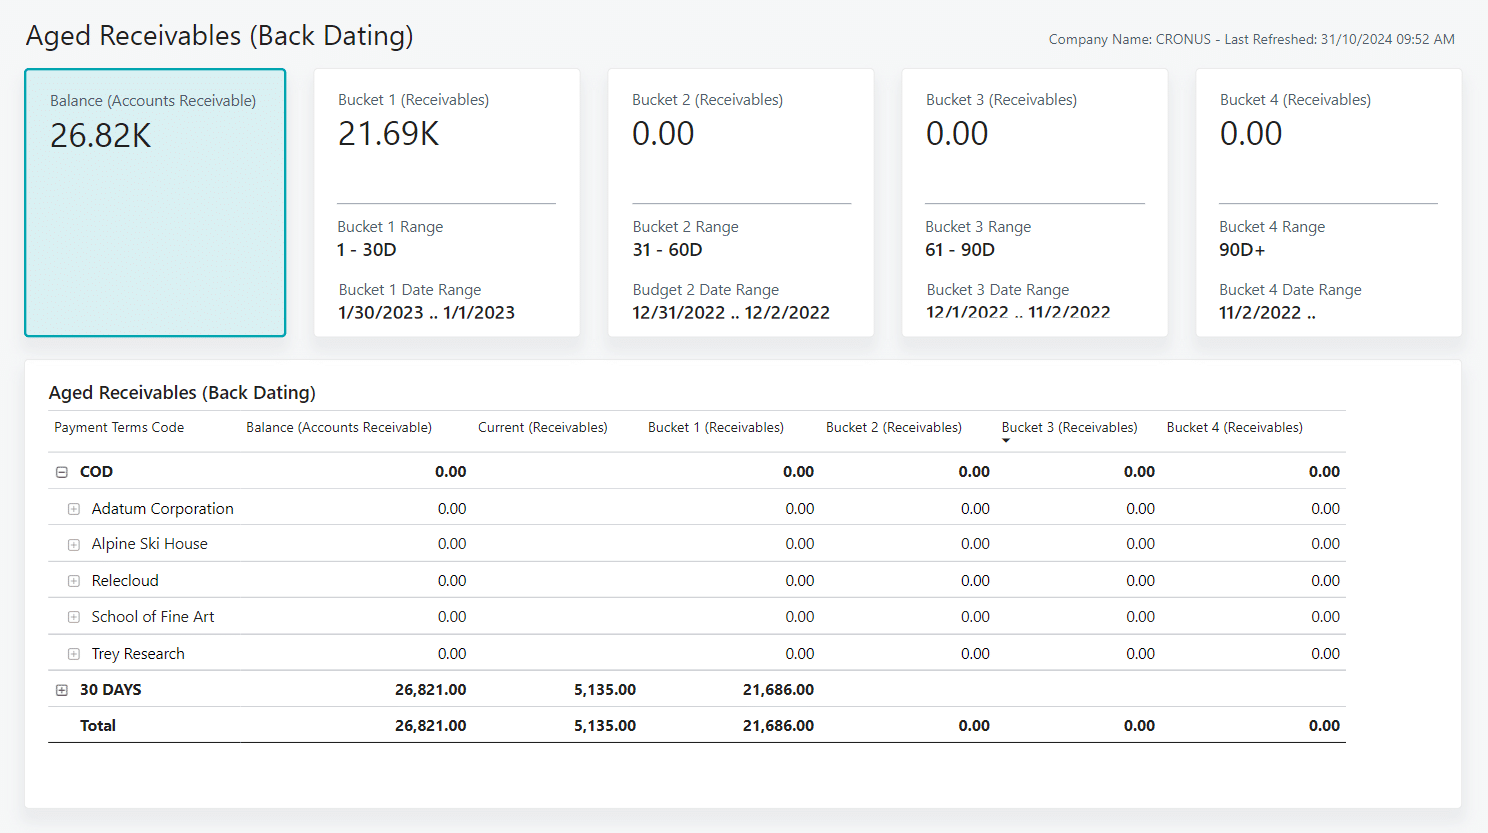
The Aged Receivables report helps you manage cash flow through a clear view of your receivables and overall financial standing. A key feature of this report is the customisable aging periods, which helps tracking overdue payments. You can further filter the report by posting date, due date, or document date and categorise it by payment terms, aligning net terms with aging periods for a deeper analysis.
You can also use the Aged Receivables report to identify overdue invoices and prioritise accounts needing immediate action. The “reviewing buckets” feature highlights customers with high outstanding balances or those who are behind on payments. By expanding the report metrics, you can quickly identify overdue invoices that require follow-up. This allows you to prioritise collections efficiently, ensuring cash flow is maintained and payments stay on schedule.
4. Period-Over-Period Report
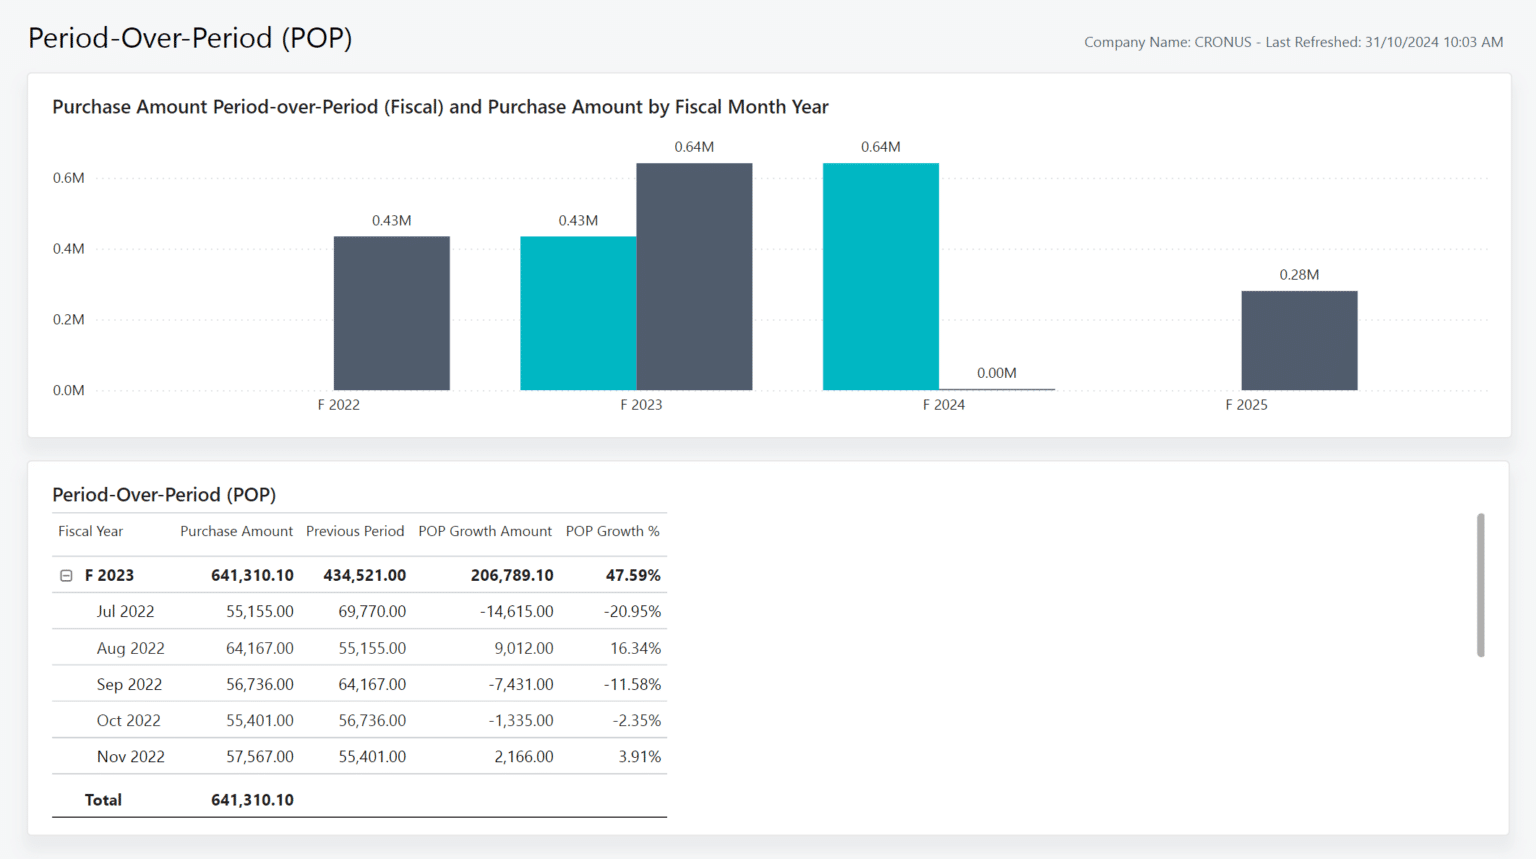
The Period-Over-Period report offers valuable insights into your purchasing performance by comparing spending across different periods and against the previous year. This helps you track growth trends, recognise patterns, and identify areas for improvement in your purchasing strategy. You can also analyse data by fiscal month or year, depending on your needs.
This report also provides a complete view of your purchasing trends over time, enabling you to see how patterns evolve year over year. With these insights, you can make strategic decisions that enhance operational efficiency and align with your goals. Additionally, you can track purchasing growth in both amount and percentage, enabling you to assess whether current spending aligns with company objectives.
5. Project Realisation Report
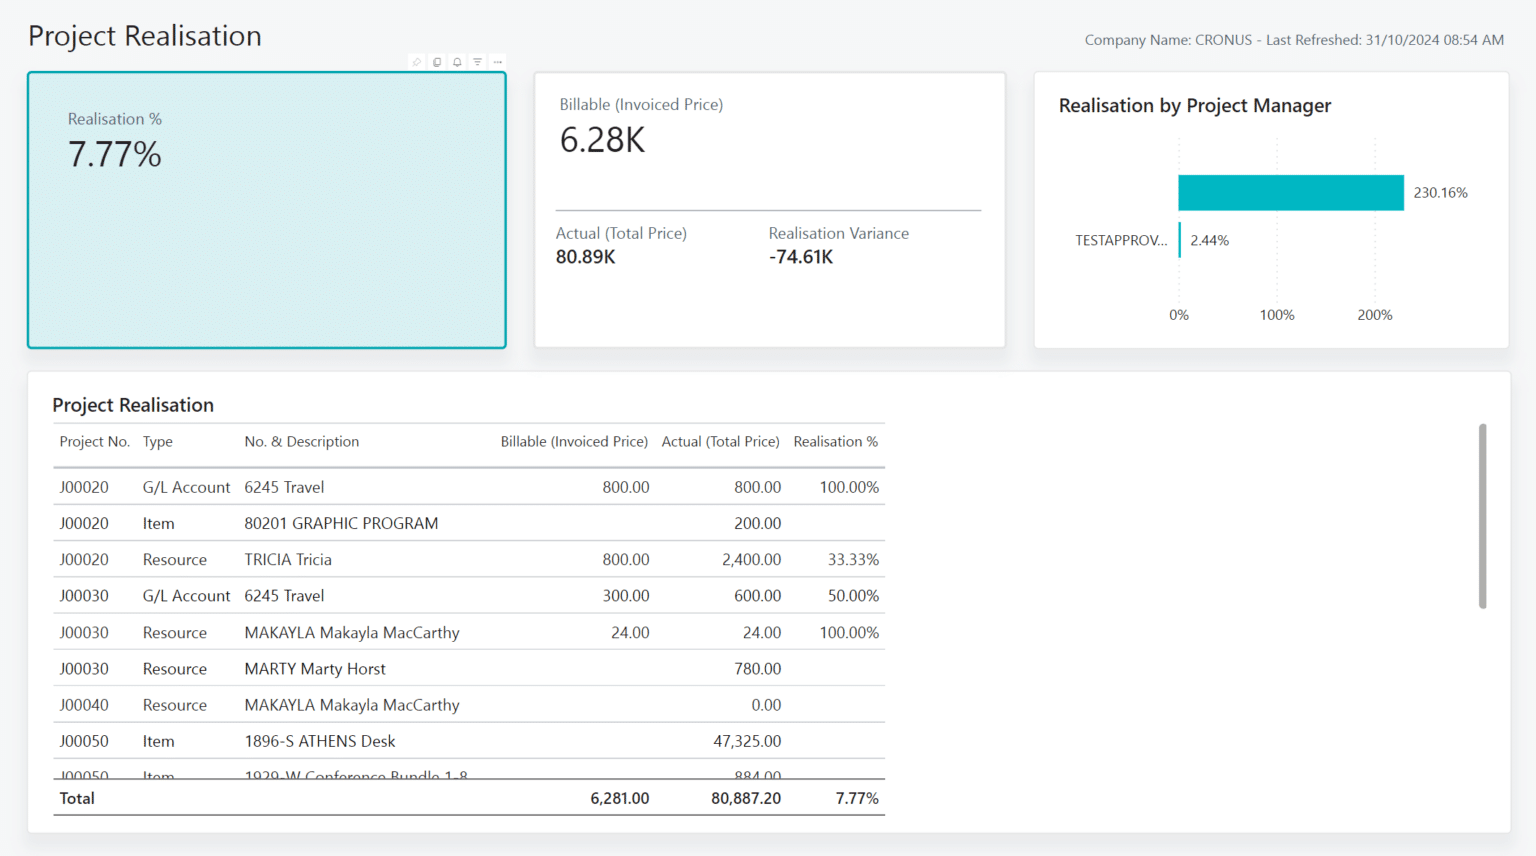
The Project Realisation report provides insights of how your project billing aligns with costs. It compares the invoiced (billable) amount to the actual cost and highlights the percentage of each project that has been billed. These insights are invaluable in maintaining control over project financials. Additionally, the report also helps identify any outstanding invoices, improving your financial oversight.
With the Project Realisation report, you can also quickly identify projects with low billing realisation. This can help you meet invoicing targets and sustain healthy turnover. Additionally, the report allows you to track projects with completed work that remains unbilled. By identifying these, you can follow up on pending invoices to keep project finances on target.
Unlock the power of embedded Power BI reports
By using these top 5 Power BI reports, you can gain deeper insights into areas of your business such as sales, inventory, finances, and projects. With these reports, you can make more informed, timely decisions that drive growth and keep you ahead in today’s competitive landscape.
To find out how to connect Power BI to your Business Central environment, please refer to this article.


